The Plots of Probability Density Functions
In many option pricing models, only the characteristic function of the return of underlying asset are known analytically.
In this case, to plot its probability density function, numerical methods can be used.
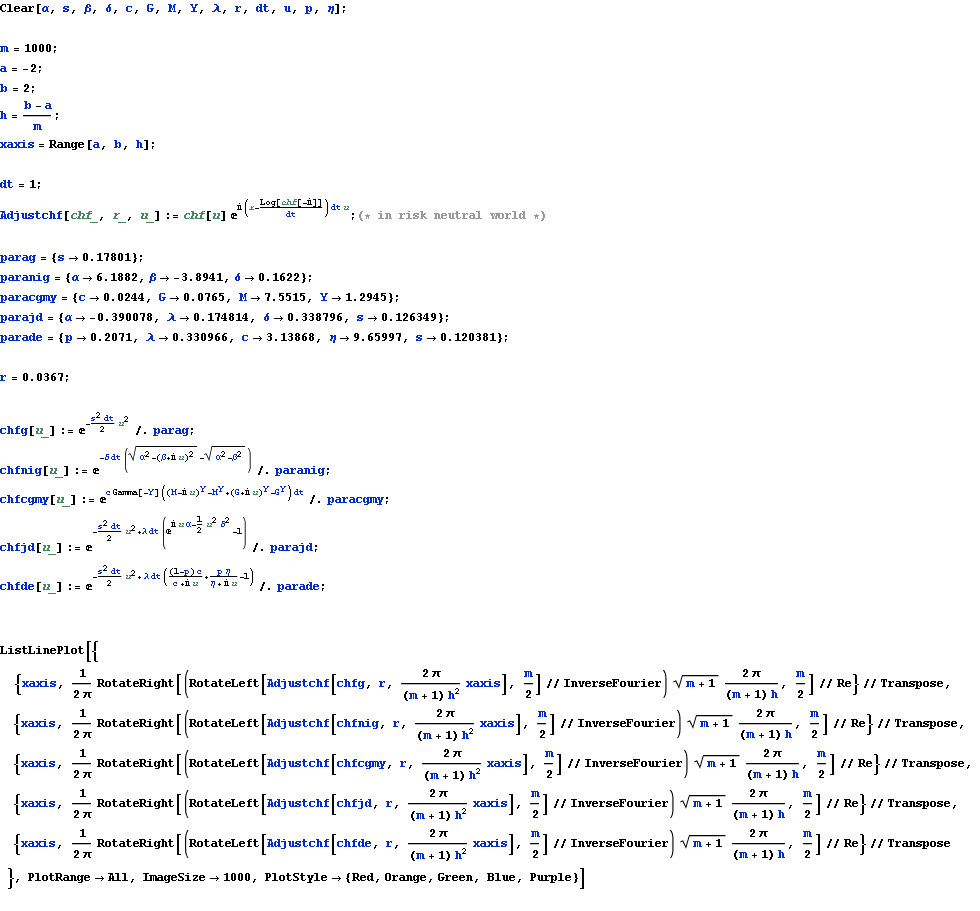
By definition, the probability density function of a random variable is the inverse Fourier transform of its characteristic function,
so the FFT algorithm can help to plot the density.
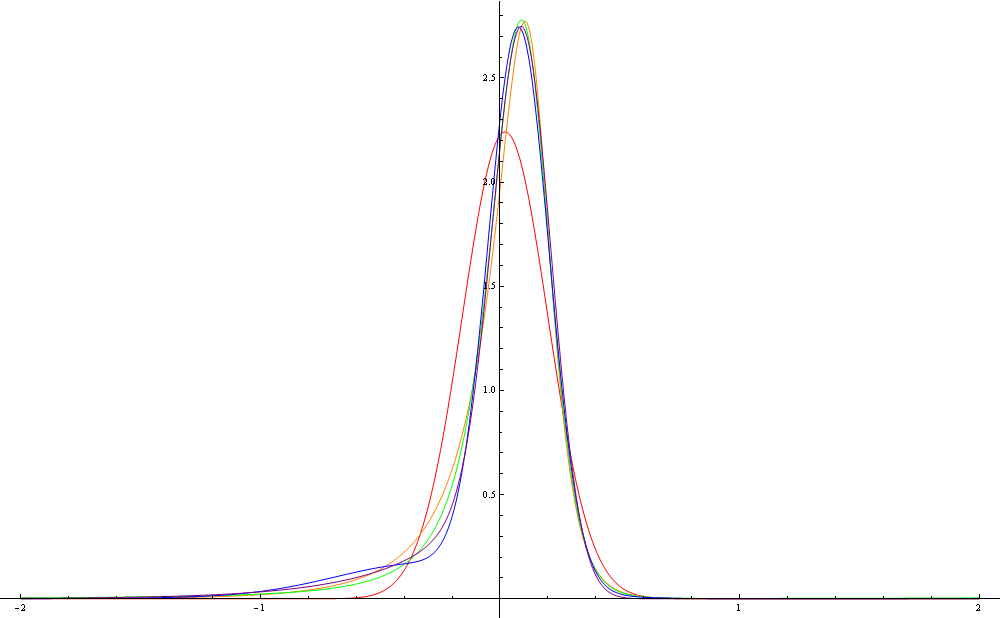
Below the plots of density functions of five different models are given.
The red line, the orange line, the green line, the blue line and the purple line are the density functions of Black-Scholes model, NIG model, CGMY model, Merton’s jump diffusion model, and double exponential model, respectively.