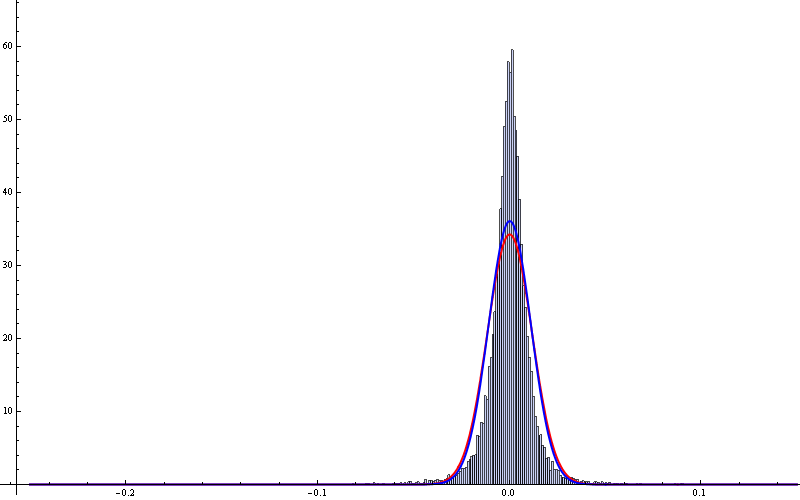
DJI histogram
Here is the histogram of the historical data of daily return of a given index.
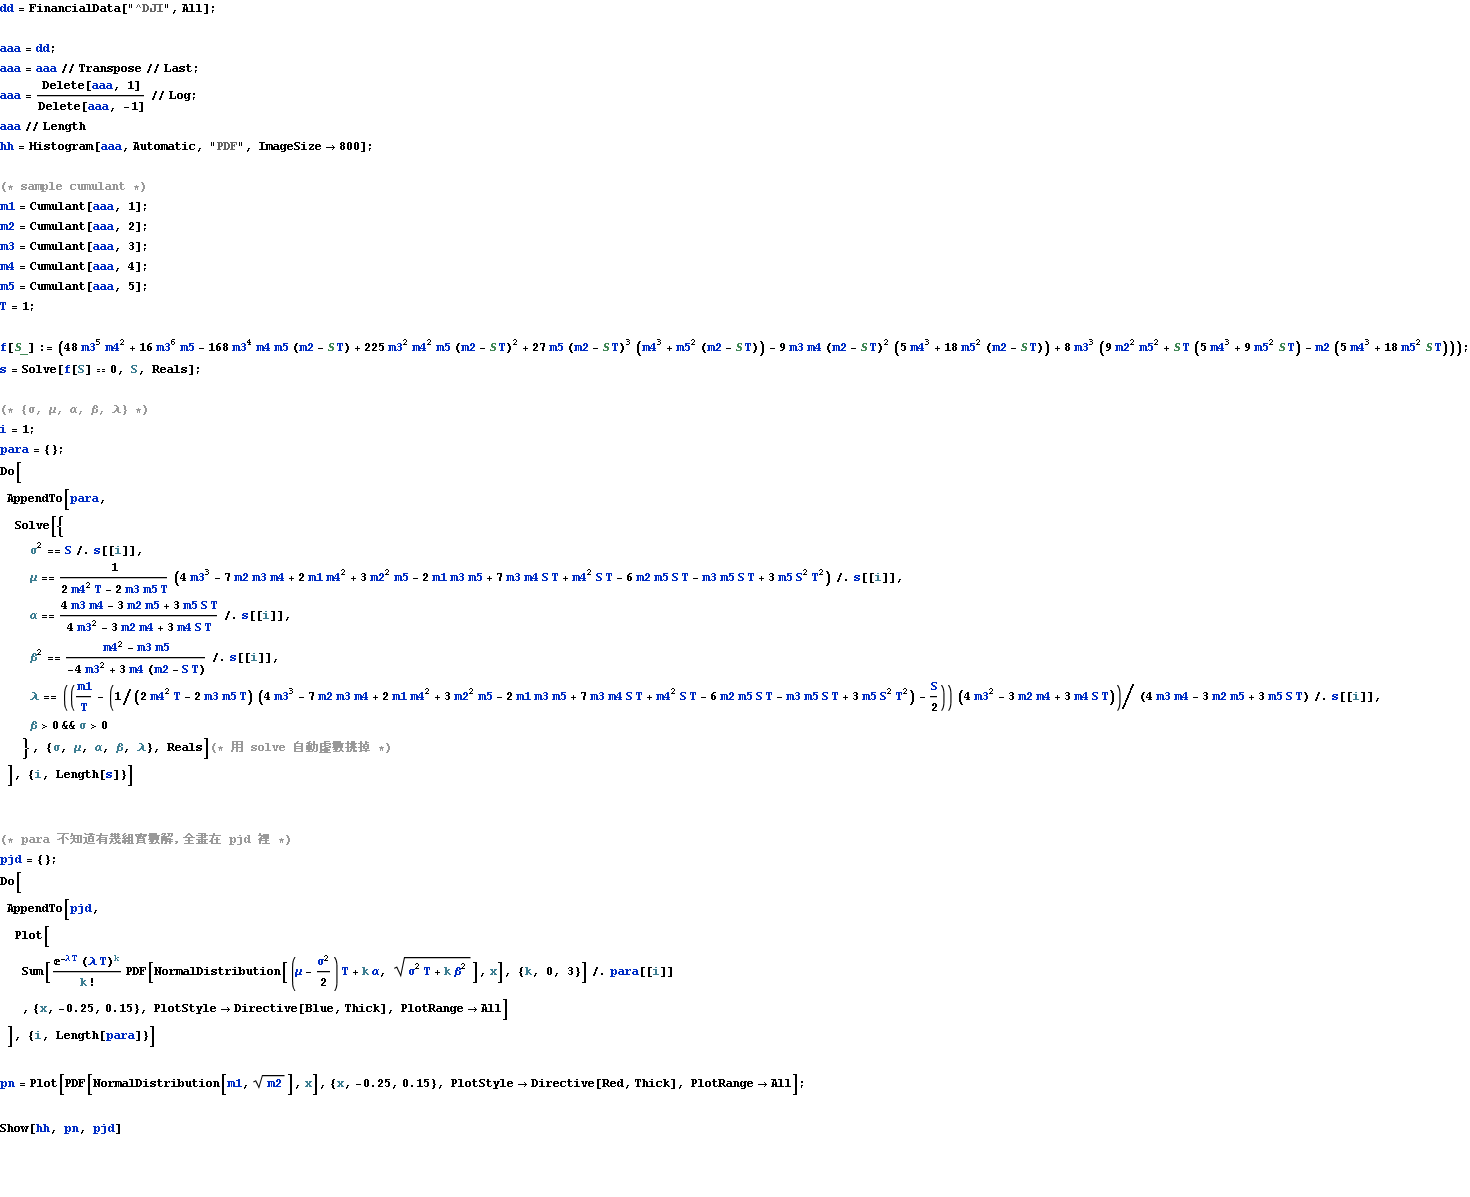
The first few sample cumulants are evaluated and are used to determine the parameter of option pricing models.
The probability density functions under the Black-Scholes model (red line) and Merton’s jump diffusion model (blue line) are shown as well.
The given index in the first line can be changed, and this program still works.